! MS-EXCEL !

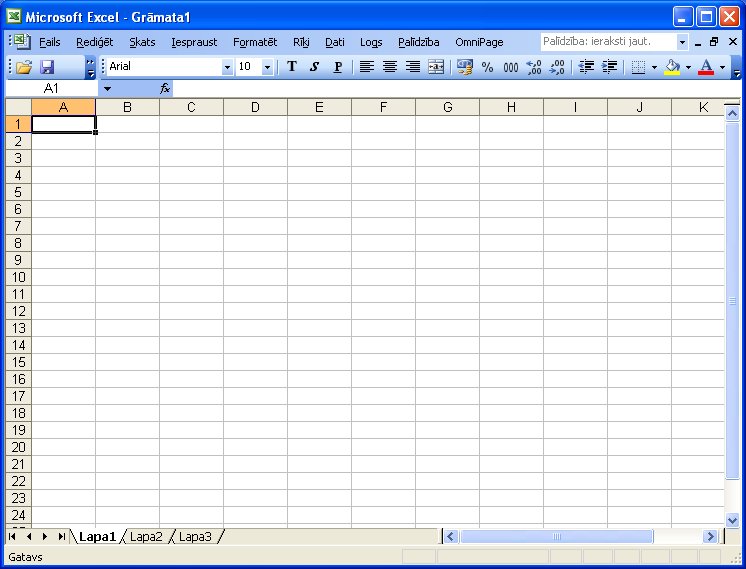
Figure: MS Excel
Excel is a powerful application package. Although excel can be used for non-numeric work-sheets, the primary goal for excel is to help us organize and manage financial information such as income statement, balance sheet etc. in excel we can create chart, pivot table, pivot char, record etc. Excel is an electronic worksheet program that supports many features, including the following:-
! FEATURES OF MS-EXCEL !

1. Automatic cell formatting.
2. Worksheets proofing tools such as spell checking etc.
3. Automatic worksheet formatting to turn you worksheets into professionally product reports.
4. Automatic row and column completion of value ranges with auto fill.
5. Built in functions such as financial formulas, that automate common tasks.
6. Powerful maps, charts and graphs that can analyze our numbers and turn them into simple trends.
7. Automatic worksheet computations that enable us to generate multiple scenarios etc.
! SOME IMPORTANT CONCEPT OF EXCEL !
• Cell:- Cell is an intersection of rows and columns.
• Worksheets:- Worksheet is a collection of cells.
• Workbook:- Workbook is a collection of worksheets.
• Active Cell:- The active cell has a dark outline. You can type data into it.
• Tool Split Box:- Drag to the right to display more sheet tabs or to the left to show more of the horizontal scroll bar.
• Scroll Bar;- Only a small part of the worksheet can be displayed inside the window. To move quickly to other cells in the worksheet we can use “scroll box”.
• Title box:- it displays the name of the workbook file. The XLS extension is the default for Excel work book files.
• Menu Bar:- it provides access to all of the Excel commands. These commands are grouped together in menus, with the various menu names displayed on the menu bar.
• Toolbar;- It contains buttons that provides fast
• access to the more commonly used commands in the menus.
• Status Bar:- The right side of the status bar shows the keyboard status. NUM indicates the numeric keyboard is active i.e. number lock.
! CHARTS IN EXCEL !
Figure: charts in excel
We can make chart in Excel by using chart wizard or standard toolbar buttons. There are 12 types of charts. Commands of making chart through chart wizard are given below.
1. Select the entire worksheet area which we want to include in out chart.
2. Select chart from insert menu.
3. Chart wizard dialog box will be open.
4. Now select any type of chart which we want to insert for our worksheet and click next.
5. Now next dialog box of chart wizard will be open.
6. If we want to change the data range then check it otherwise click on next.
7. Now next dialog box of chart wizard will be open. Here we give the name of fill x-axis, y axis etc. click on next. Then 4th box will be open. Give the place of chart and check on finish.
8. Now chart will be prepared or made.
! FORMATTING A CHART !

Formatting improves the appearance of a chart. You can format the chart to add titles, change the text, font, width, border style of a chart . You can also change the numbers on value axis, hide or show gridlines.
! Changing Backgrounds, Colours And Patterns: !
1. Double click on the plot area.
2. Formal Plot area dialog box is displayed.
3. Select the suitable border style or color on Patterns tab.
4. Press the fill effects button.
5. The fill effects dialog box will open.
6. Click on Patten tab.
7. Select the pattern and click Fore-Ground and back Ground Colour.
8. Click on Twice and observe the change.
1. Column
2. Bar
3. Line
4. Pie
5. XY ( Scatter )
6. Area
7. Doughnut
8. Radar
9. Surface
10. Bubble
11. Stock
12. Cylinder
! Changing Backgrounds, Colours And Patterns: !
1. Double click on the plot area.
2. Formal Plot area dialog box is displayed.
3. Select the suitable border style or color on Patterns tab.
4. Press the fill effects button.
5. The fill effects dialog box will open.
6. Click on Patten tab.
7. Select the pattern and click Fore-Ground and back Ground Colour.
8. Click on Twice and observe the change.
! TYPES OF CHARTS !

1. Column
2. Bar
3. Line
4. Pie
5. XY ( Scatter )
6. Area
7. Doughnut
8. Radar
9. Surface
10. Bubble
11. Stock
12. Cylinder